3D Printer Resonance Rejection Calibration

I'll bet you've heard about how noise-canceling headphones work to help block outside noise. It can be quieter than the seal the actual headphones make! Did you know that 3D printers can do the same thing?
Well, sort of. In 2024, I performed some analysis to tune out my 3D Printer's ringing artifacts. These artifacts (sometimes called ghosting) might look cool sometimes, but they're a sign of errant vibrations showing up on your print surface and I wanted to get rid of them.
Check out my LinkedIn!
Resonance Rejection Using Input Shaping
My 3D printer at the time was a heavily modified Creality CR-10 from 2016 that ran on Marlin firmware. I was used to using Marlin for the longest time since that's what reprap printers ran on. Marlin has many great features and is relatively simple to set up. One of its many features is called input shaping – A technique that would get rid of the nasty ringing happening in my prints. Ringing, in general, is caused by the 3D printer frame vibrating and causing the nozzle to impart those vibrations into the print. So, the solution will involve those vibrations somehow.
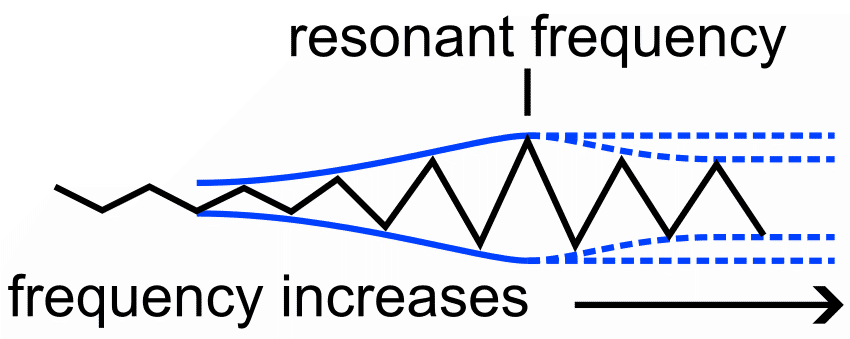
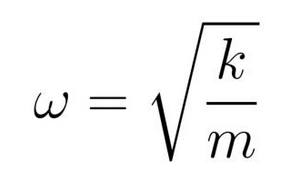
According to Marlin's input shaping documentation, input shaping works by sending out an "anti-vibration" signal to cancel out the printer's resonant frequencies. The frequency of the anti-vibration signal has to match the printer's resonance frequency, which to me sounds like Marlin is effectively doing active noise cancelling on the printer's frame! That's so cool! This means I had to somehow figure out the printer's resonant frequencies so that Marlin knows what to cancel out.
Automatic Input Shaper Calibration?
By the way, there are other 3D Printer controller firmwares on the market. One notable example is Klipper. Klipper became popular very quickly in the custom 3D Printer scene due to its more modern web-based interfacing, breadth of features, and support. Klipper has input-shaping capabilities as well and actually allows you to attach an accelerometer to the 3D printer and do a frequency sweep to automagically figure out the printer's resonant frequency!
Unfortunately at the time, Marlin did not support such automatic accelerometer calibration, despite calling out its popularity:
Low-frequency vibrations are very easy to pick up with an accelerometer, so these inexpensive components are becoming more common in consumer 3D printers. With the accelerometer attached the printer runs a move series to introduce and measure vibrations, then it tests various shapers at different frequencies to find the best solution.
It’s a hassle to attach and configure an accelerometer on most printers that run Marlin, so for now we recommend using [manual methods]
Manual Input Shaper Calibration :(
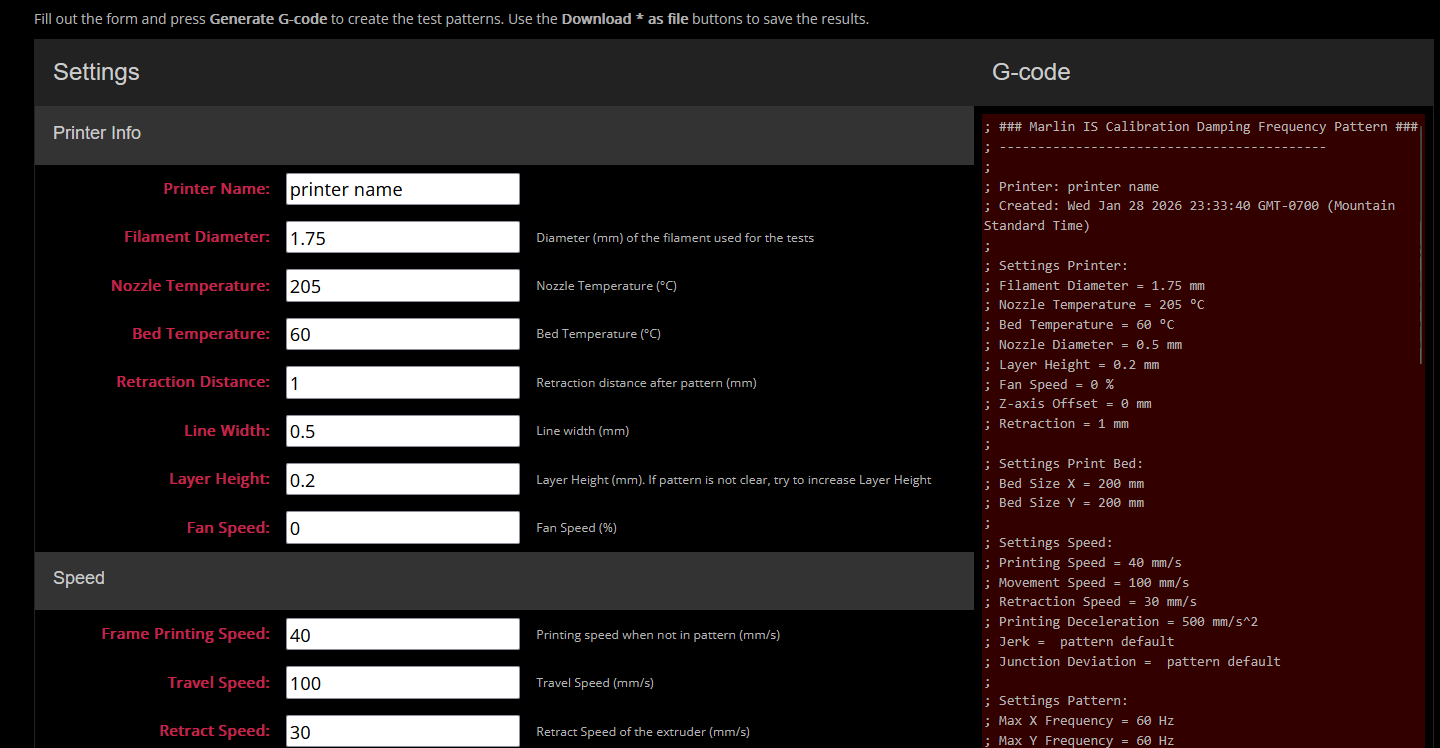
Marlin's suggested way of determining the printer's resonant frequency is to run some G-code that prints a zig-zag on the print bed at varying speeds (effectively a frequency sweep) and determining when the oscillations start to affect the pattern the most. This is a visual estimate by the naked eye. The location of where the pattern changed on the print bed can then tell you what frequency the printer performed the worst at.
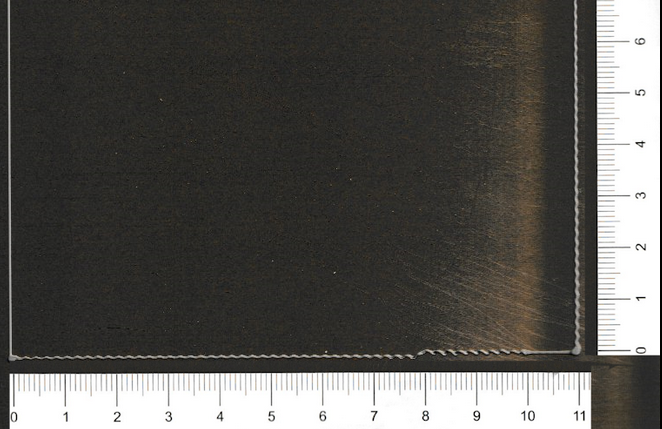
That sure seemed straight-forward to me! I gave the G-code generator a shot and watched as my print did some zig-zags and caused my printer to move pretty violently. Sadly, after trying multiple frequency sweeps and multiple speeds, I could not get results where the resonant frequency was apparent to me.
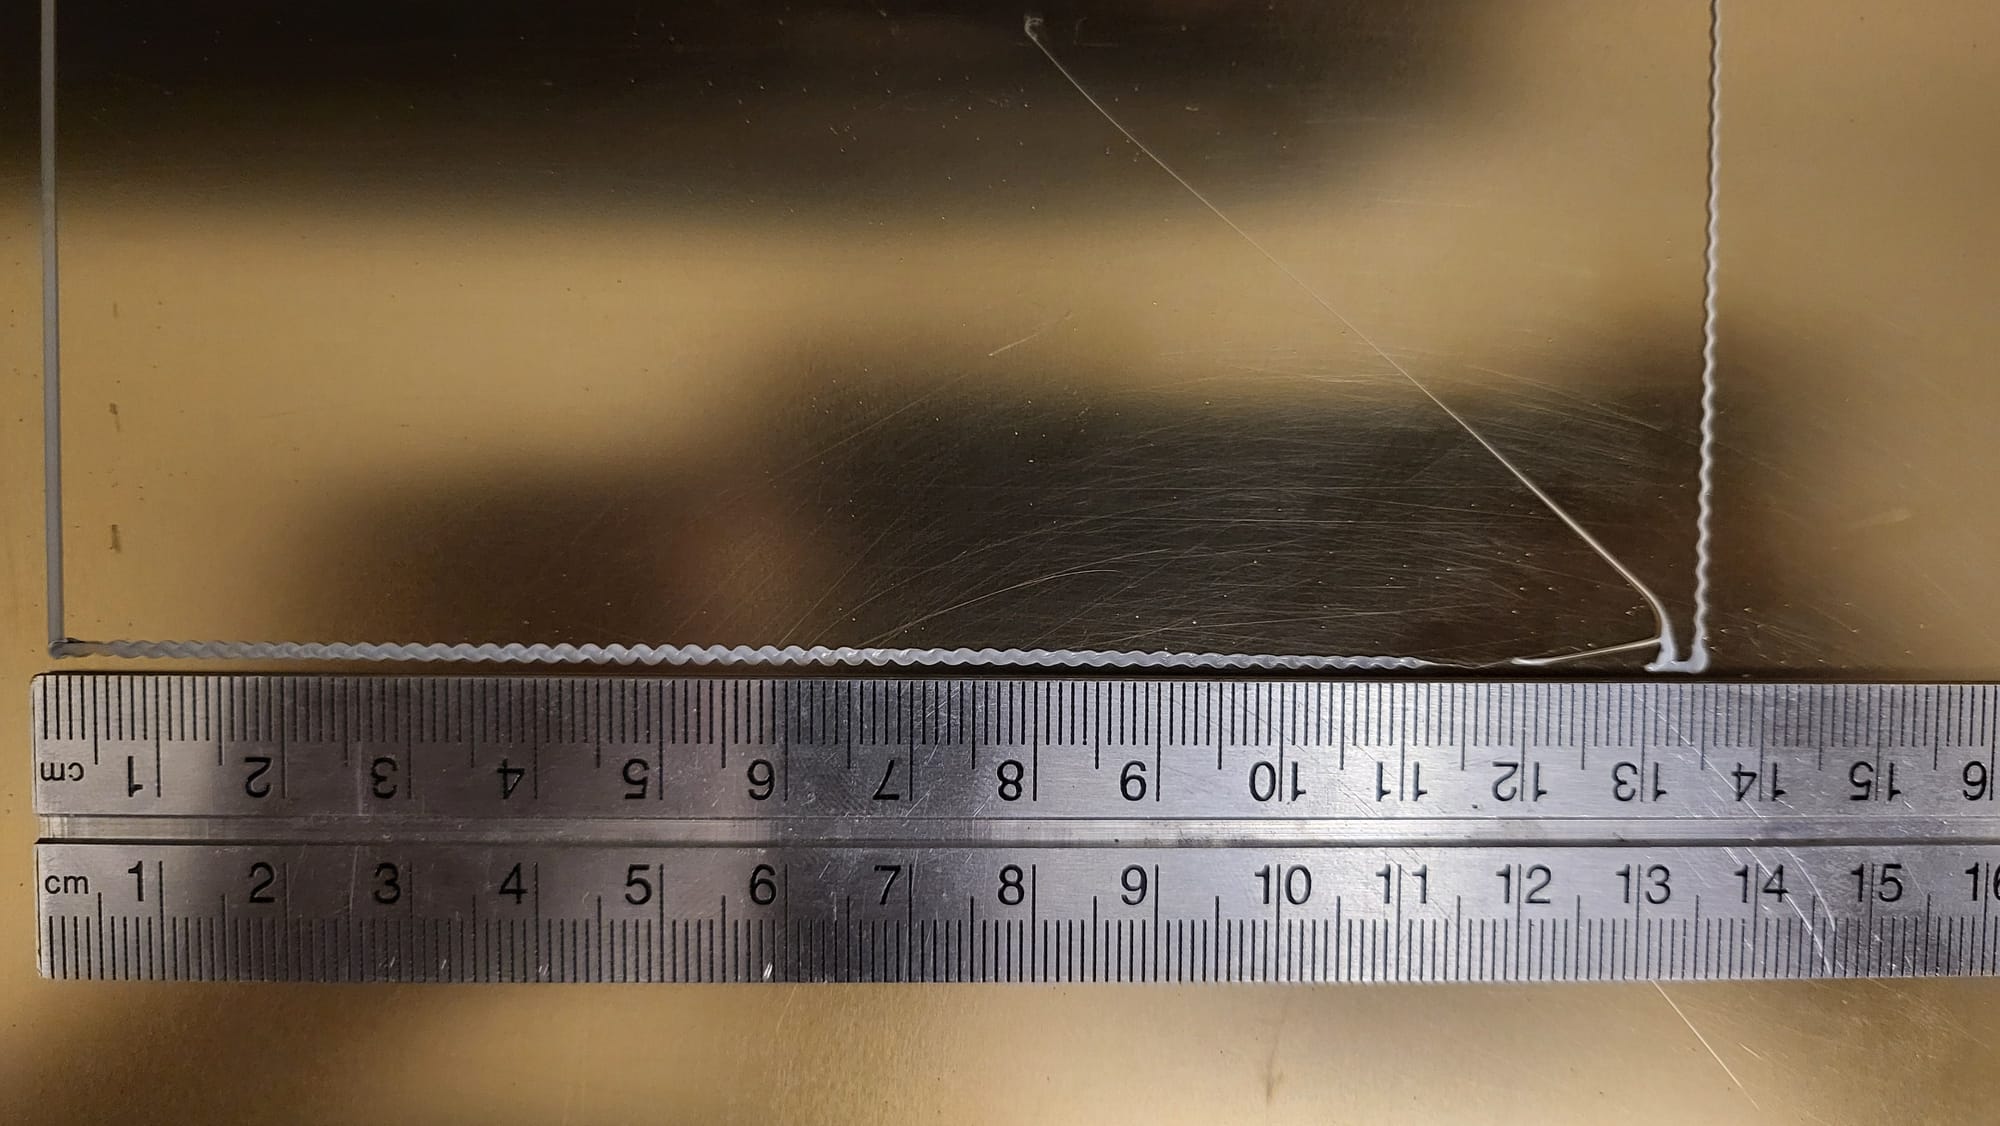
Using the image above, maybe you could say the pattern changed a little after 110mm, but that would lead to the resonant frequency being above 55Hz. However, that seems a little high. It especially doesn't make sense because that horizontal line is measuring my Y-Axis's resonant frequency. Since my printer is a "bed-slinger", the whole bed moves along the Y-Axis as part of the motion system. That bed has a ton of mass, so one would expect the resonant frequency to be somewhat low.
Fine, I'll do It Myself
At this point it was clear Marlin's manual frequency sweep technique wasn't gonna cut it for me. Now I could've stopped here and gone through the process of switching to Klipper so that I could just automatically calibrate these parameters without a fuss, but I didn't understand it at the time and I feared it. (Though now I'm all in on the Klipper train despite my love for Marlin). So I found a different solution.
I thought "I have an accelerometer...and some microcontrollers... I can just automatically measure the resonant frequency myself"! Since you can just enter the values for resonant frequency in Marlin's configuration, one can just determine those values with any technique.
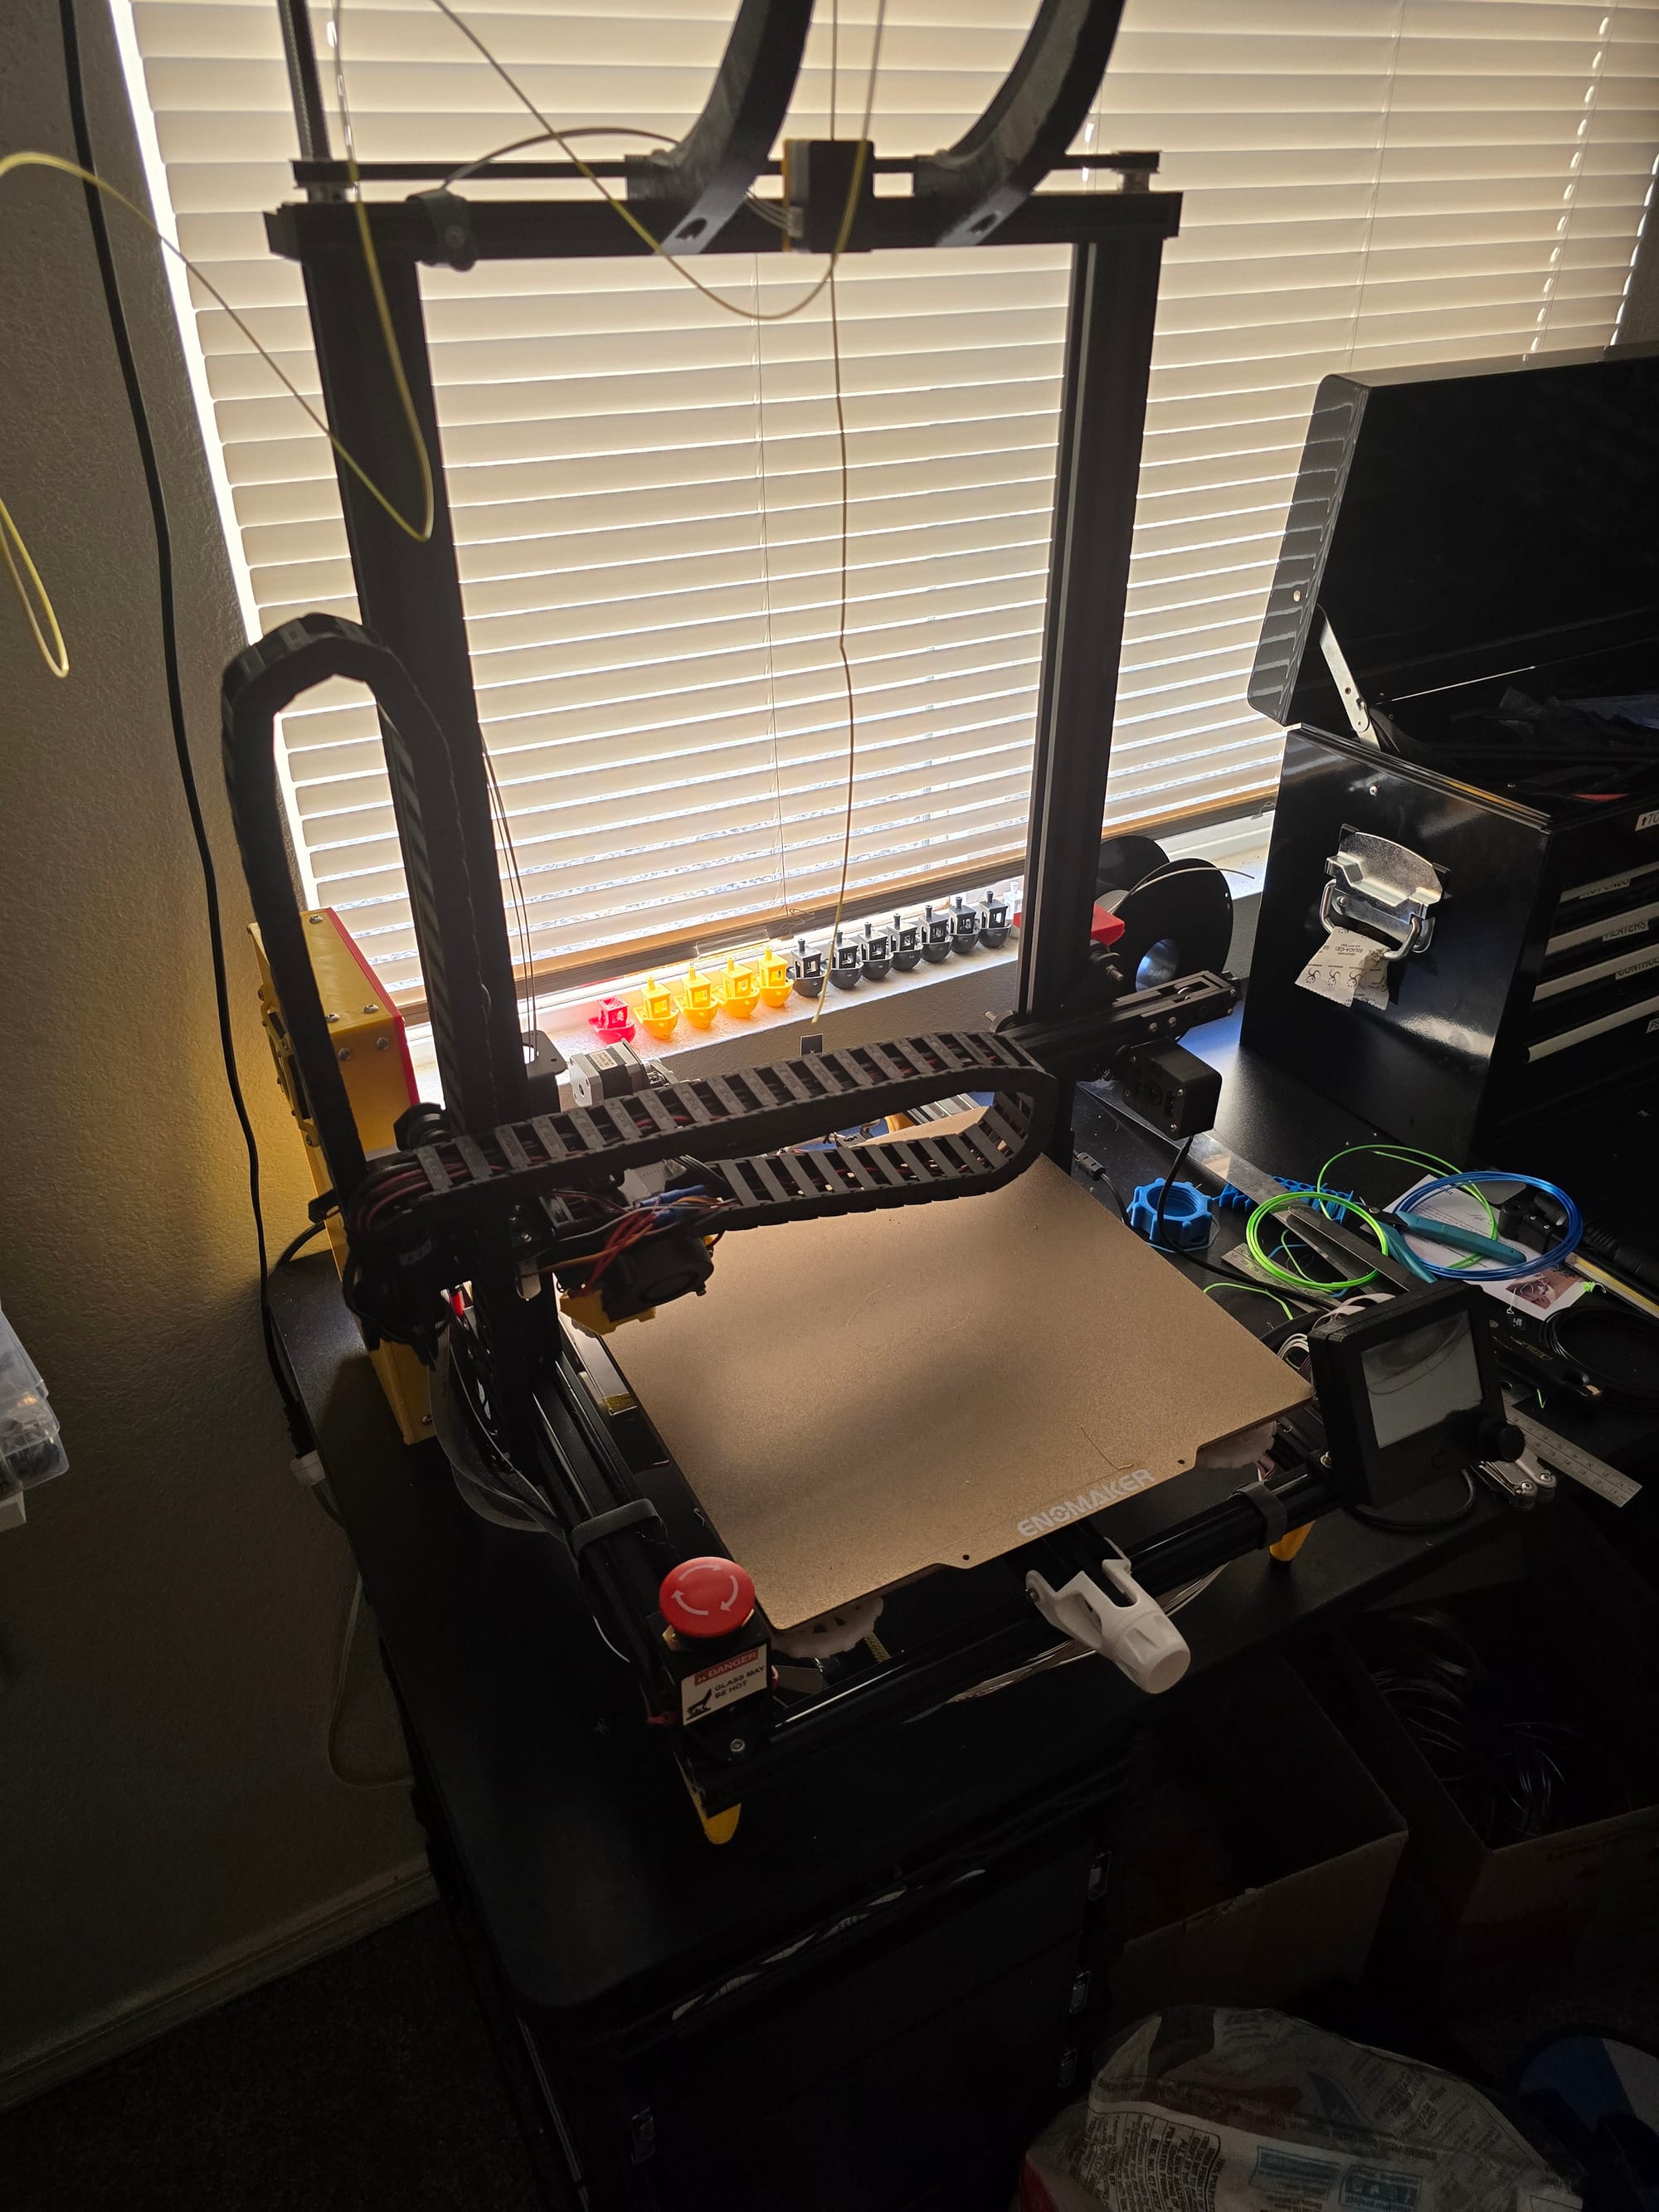
Accelerometer Mounting
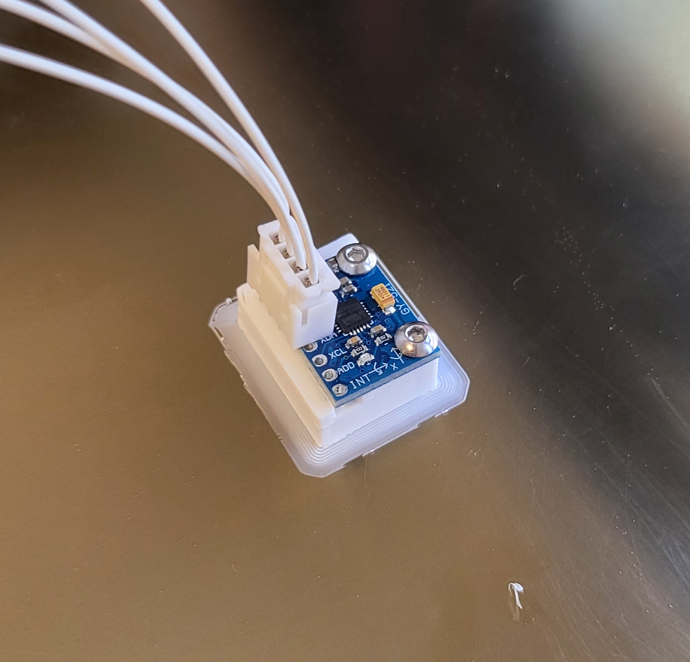
To do this, I had to mount my accelerometer to the printer. Luckily, you can cleverly print a mount for the accelerometer and just leave it on the build plate to end up with a rigid mount for measuring the Y-Axis. The X-Axis will need a custom mount, so I designed a quick fixture for it.
Data Acquisition Code
Next was writing some quick Arduino code to poll the acceleration data from the PCB. Since I'm interested in frequency, timing data had to be recorded as well. I wrote the script I needed using PlatformIO. (Marlin is built using PlatformIO!)
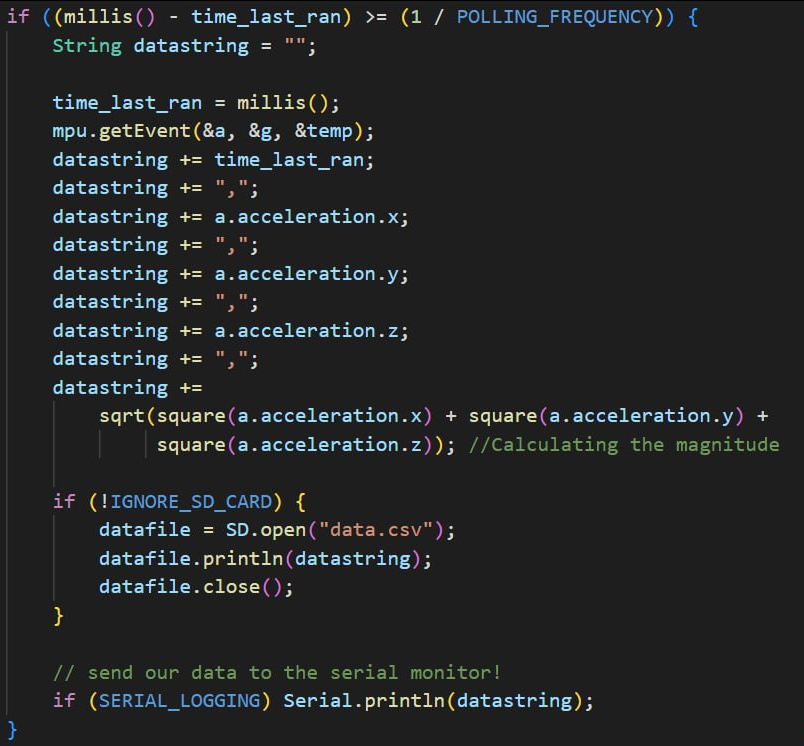
It should be noted that technically, this code samples the acceleration slower than the polling frequency since it waits for millis()-time_last_ran to be longer than dt. Oops! But it's okay, the Arduino should loop fast enough that it won't be that much lower and we're way beyond the 2x minimum threshold of minimum sample rate, so I've got some cushion.
Using that code, I can open a Putty session and record the serial monitor to a file, directly saving it as a CSV! The only thing left to do was run the frequency sweep.
Frequency Sweep G-code Modification
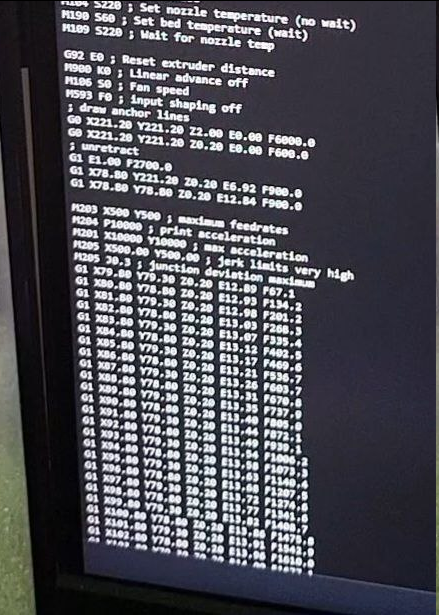
I could've simply reused Marlin's frequency sweep G-code from before, but that tries to print on my bed and I'd have caused a collision with the accelerometer stuck to my bed.
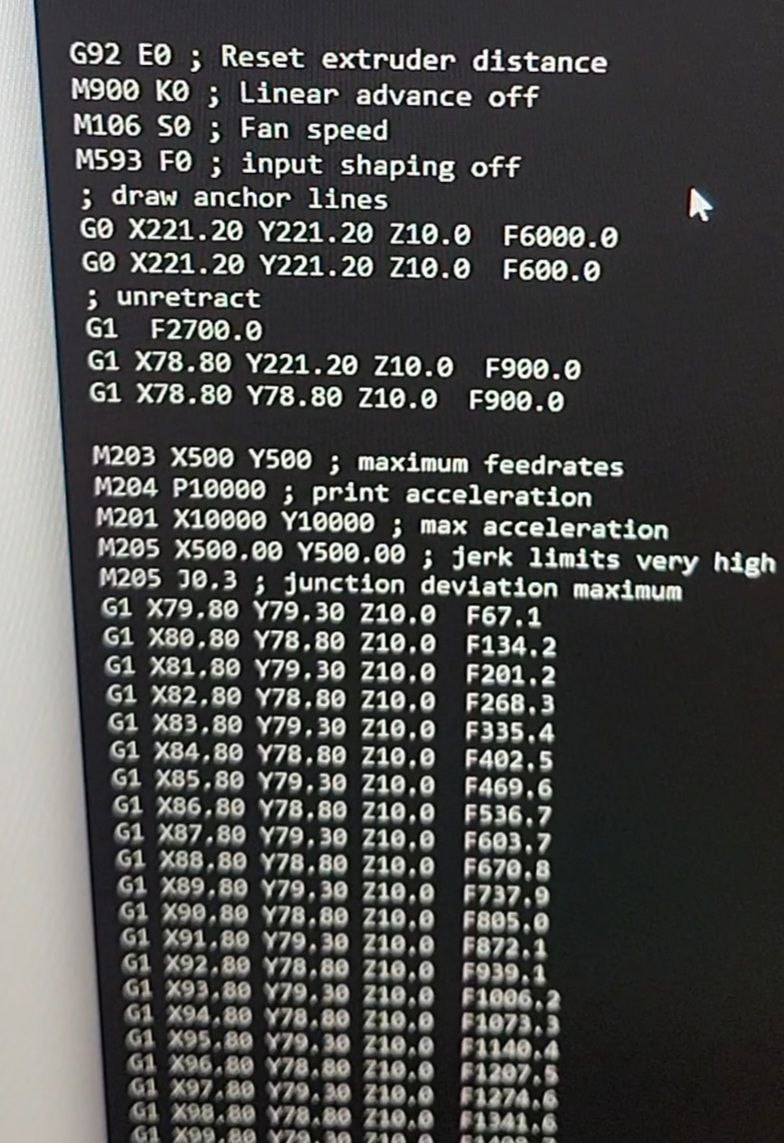
I ended up dragging the G-code into my web browser and ran some Javascript in the console to get rid of anything in the code that looked like "Zxx.xxx" and replaced it with "Z10.0". I used RegEx to just replace everything in the whole file. This made it so the frequency sweep routine only ran 10mm above the bed, avoiding the sensor. I did a similar replacement to get rid of every extrusion move (Exx.xx) so it wouldn't try to extrude when all I need it to do is move the axes. Lastly, I deleted the temperature settings at the beginning, since again, I don't need to actually heat up the plastic.
$0.innerText = $0.innerText.replace(/Z\d+\.\d+/g,"Z10.0");The code I ran simply looked like this
Data?
I now had all the pieces to be able to record the data I needed! I ran the frequency sweep a couple times for X and Y axes individually. Using the CSV file that Putty spit out, I could load the data into Excel and create an Acceleration vs Time plot to see what things looked like.
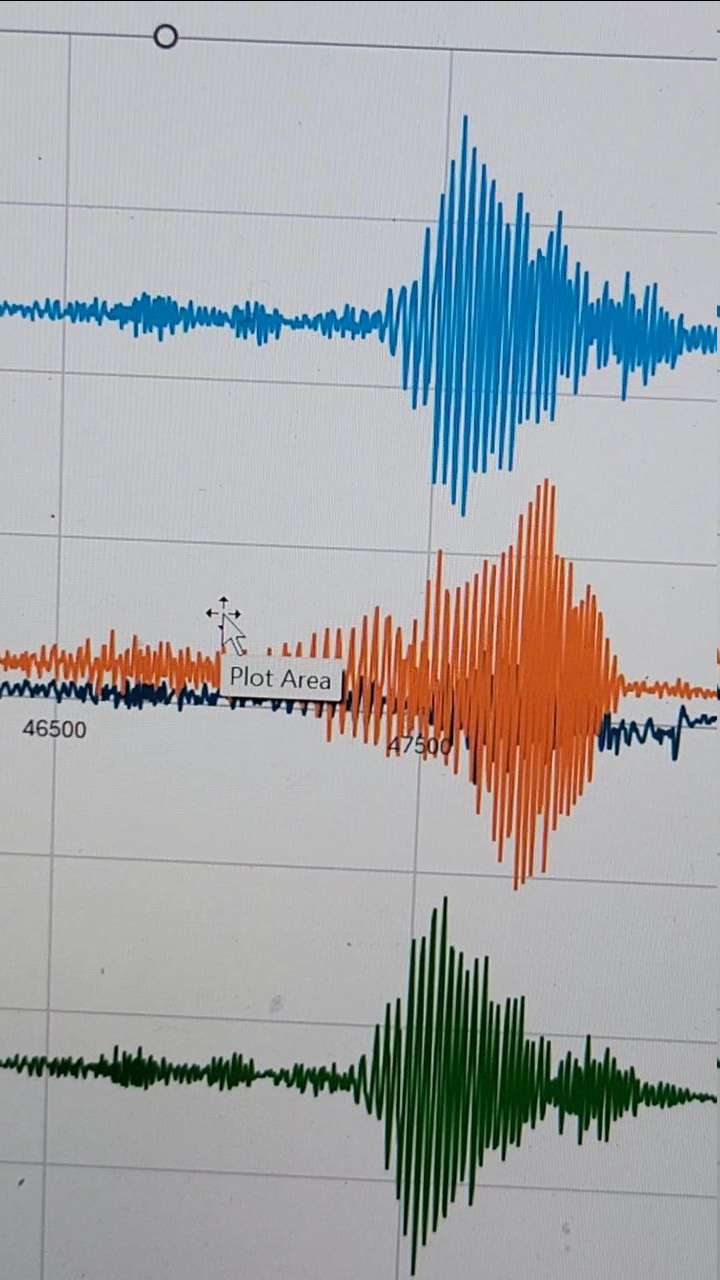
Hey, that's a good sign!! we have distinct locations where the magnitude of the accelerations are the highest. This is just a time plot that doesn't give me frequency though. To extract that data, I could figure out at what time t the max magnitude happens and then figure out what frequency the G-code was running at that point.
That felt too sloppy, so instead, I did a fourier analysis!
Analysis
At the time, I didn't have MATLAB, which would have been the perfect tool for this. Luckily, there's a free open-source alternative called GNU Octave that does pretty much the same thing.
N = length(accely);
sampling_interval = mean(diff(time)); %average sampling interval
Fs = 1/sampling_interval; %sampling frequency

f = Fs*(0:(N/2))/N; %fft gives a plot of positive and negative frequencies.
% so need to build the list of positive frequencies in the fft plot.

Y = fft(accely); % perform the fft
P2 = abs(Y/N); %normalized two sided spectrum
P1 = P2(1:N/2+1);%one sided only (the positive side) up to the nyquist freq.
P1(2:end-1) = 2*P1(2:end-1); %doubling the energy since we deleted half of it.
The important part of my matlab code. The code to build P1 (the amplitude spectrum) is a standard routine that I took from sample code online. I added comments above.
Again, I didn't care about the actual amplitude or power value, only where the maximum frequency occurred, so I could just use max() to figure out what that frequency was.
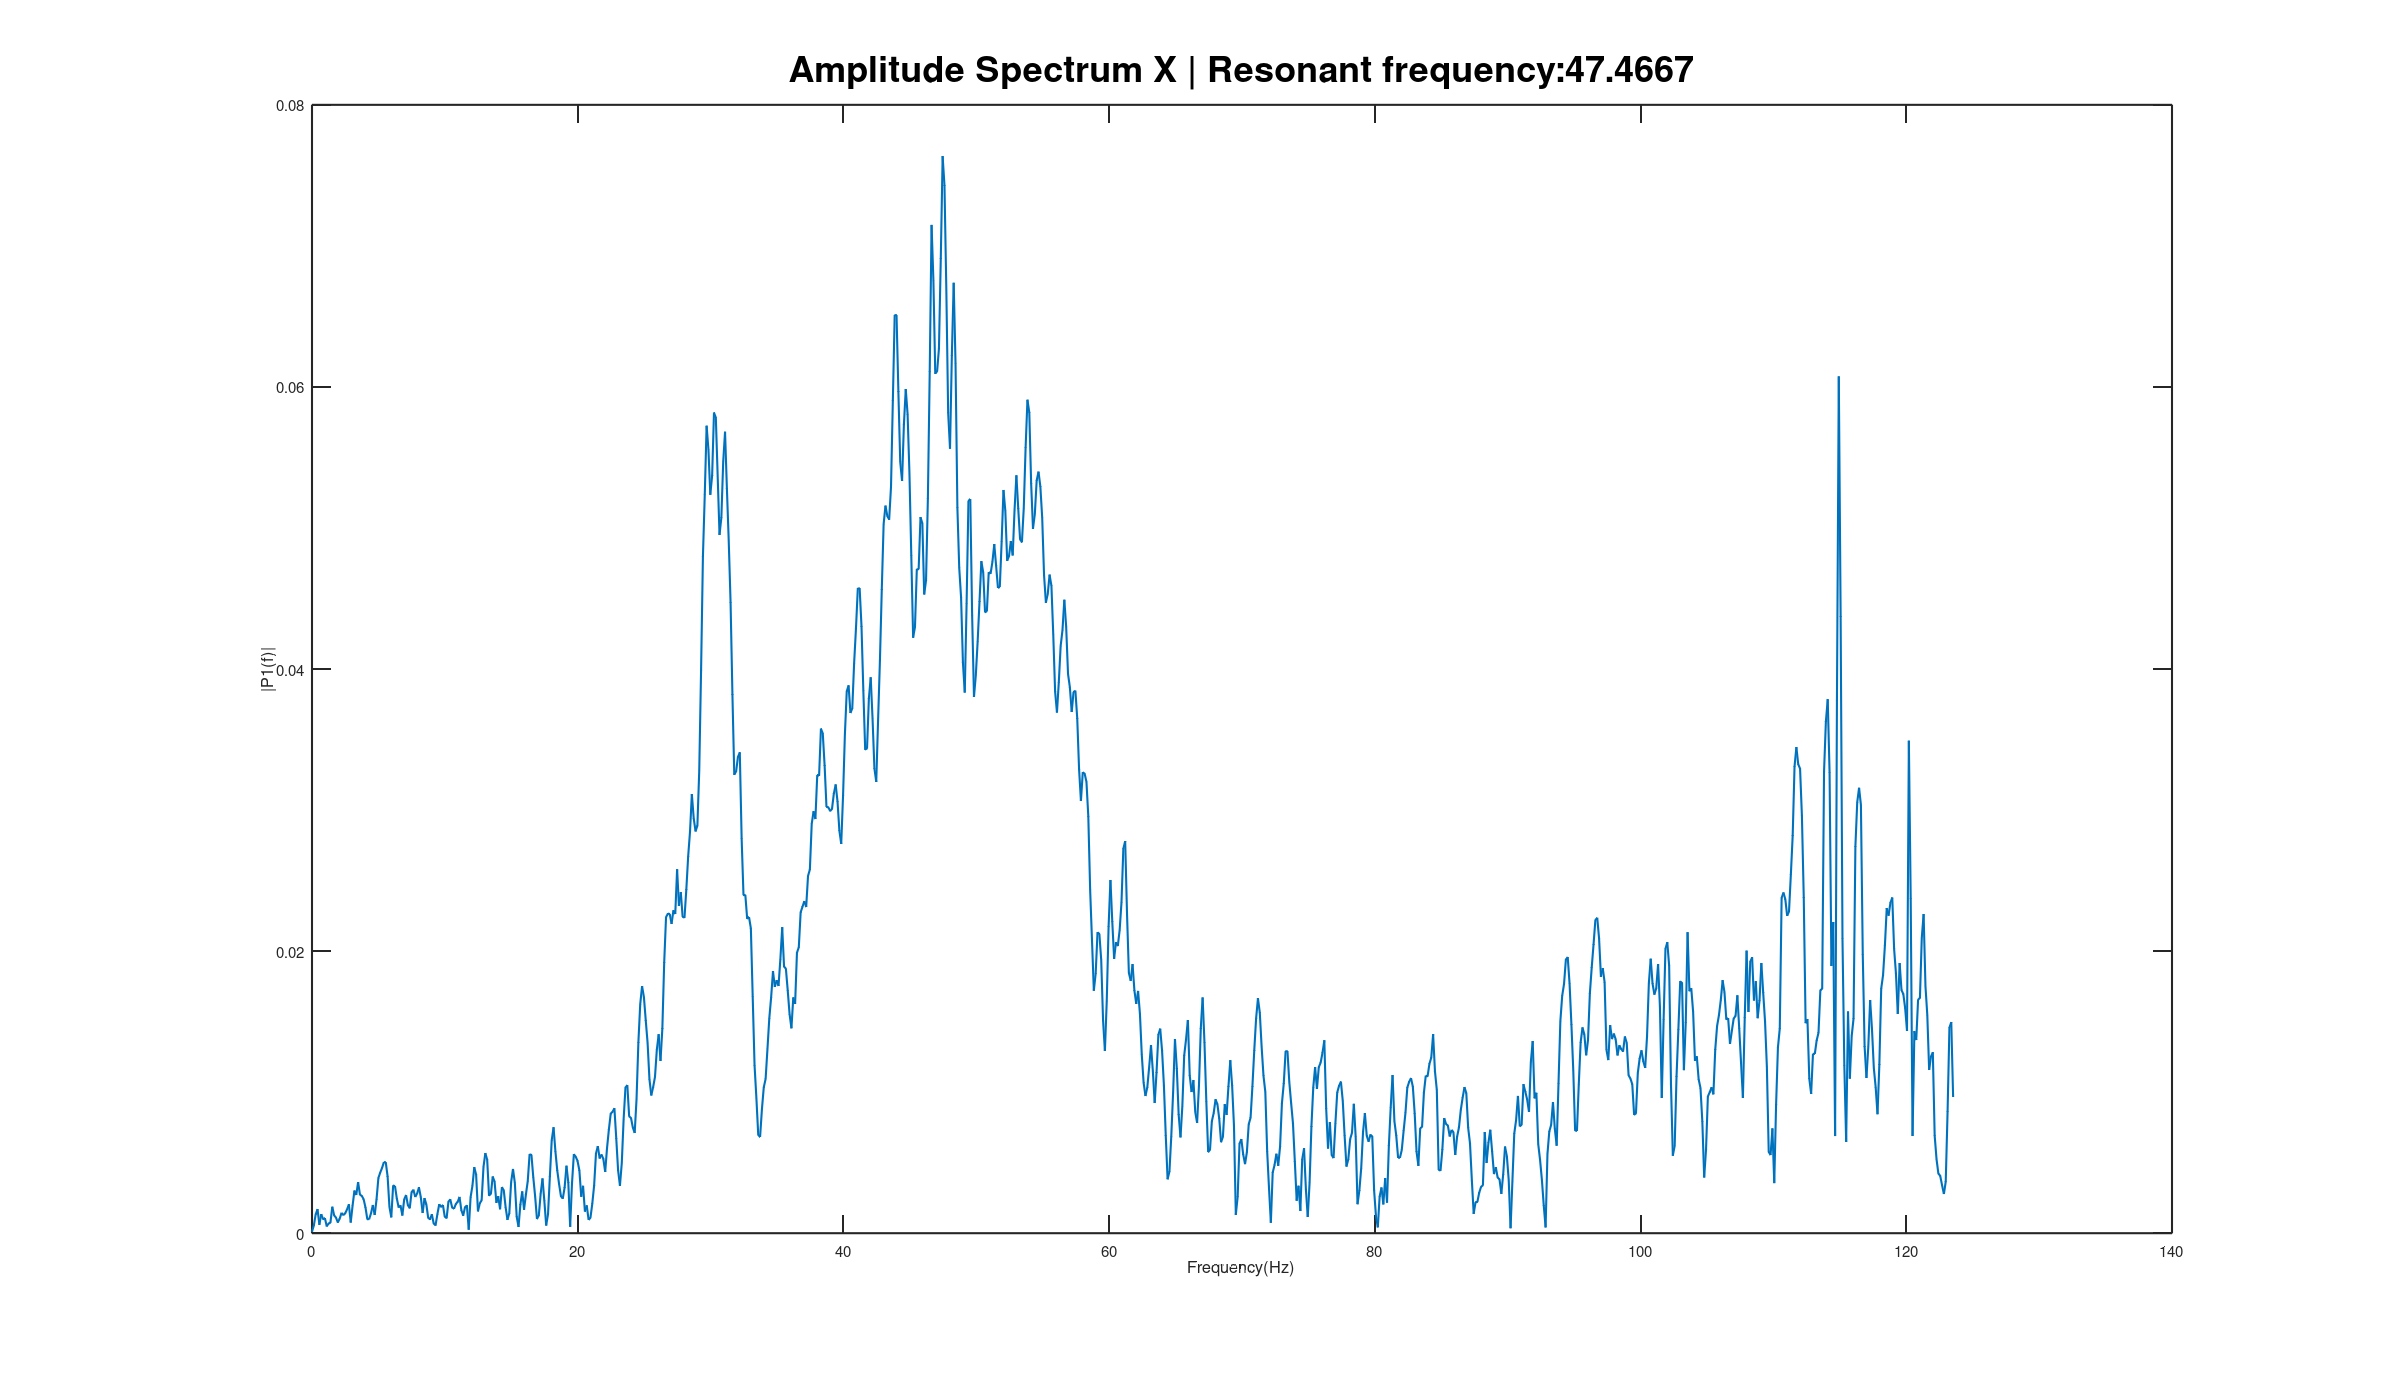
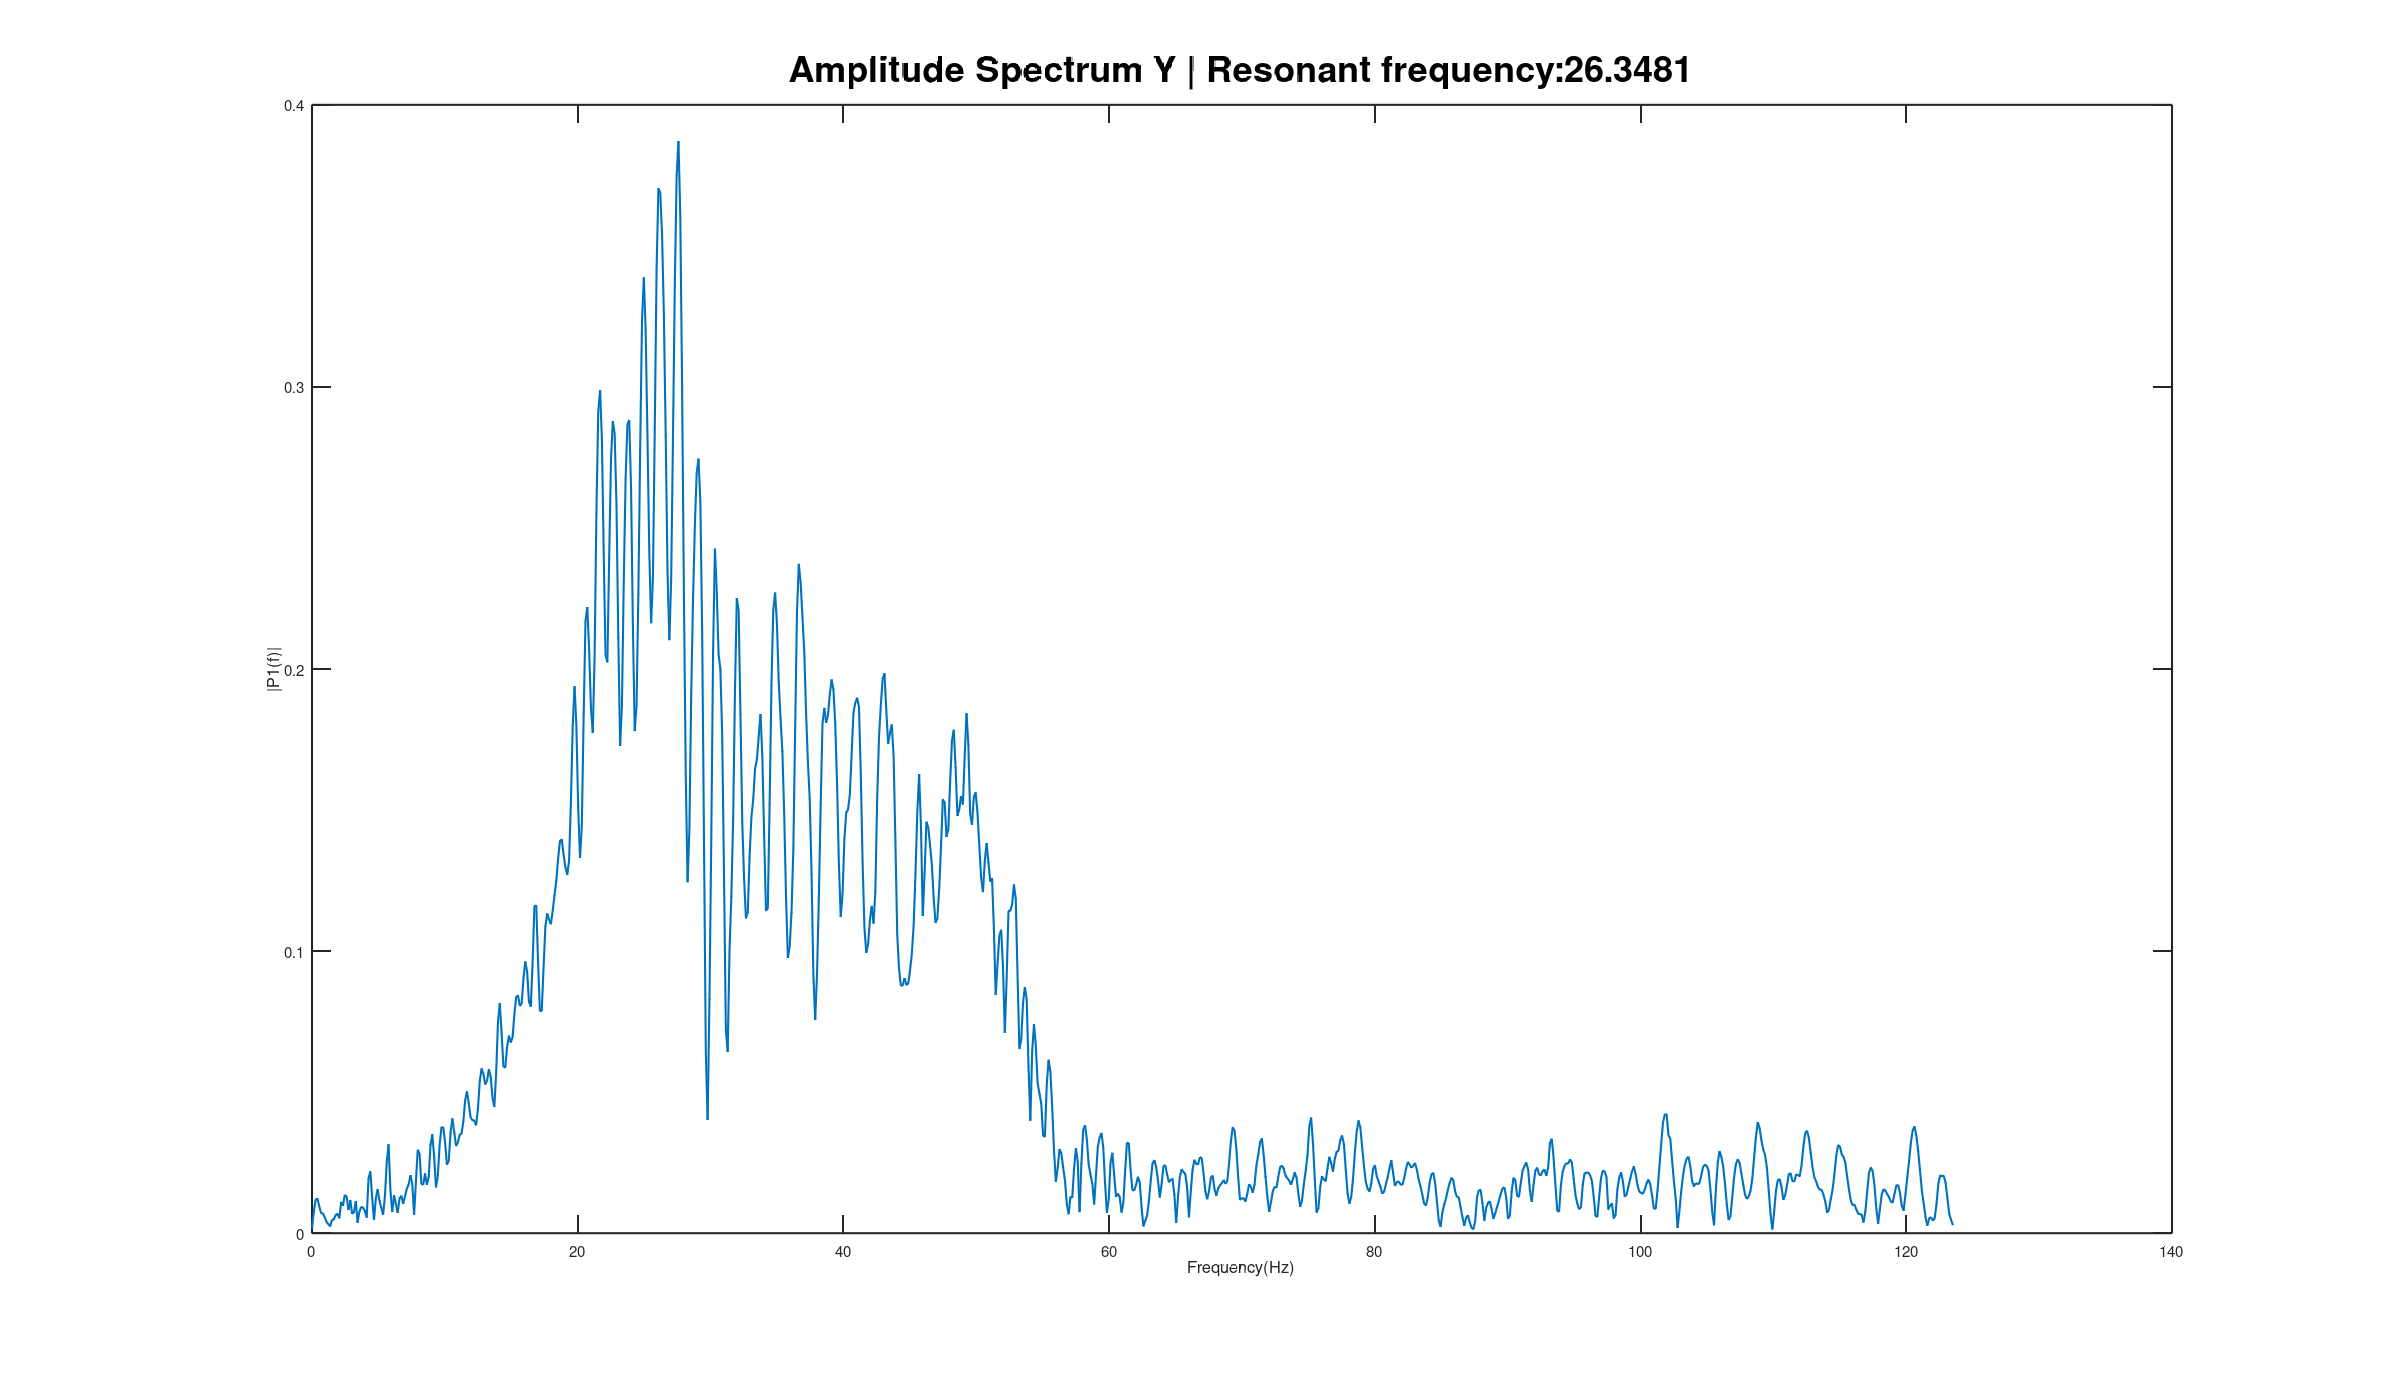
After running the analysis, I got the above plots! Do they make sense? X-Axis resonant frequency is 47Hz and Y-Axis resonant frequency is 26Hz. Well, I expected the Y-Axis natural frequency to be lower than the X-Axis due to the higher mass, so it seems like it worked! With the required data for Marlin's input shaping to work, I started a test print.
The Prints Improved
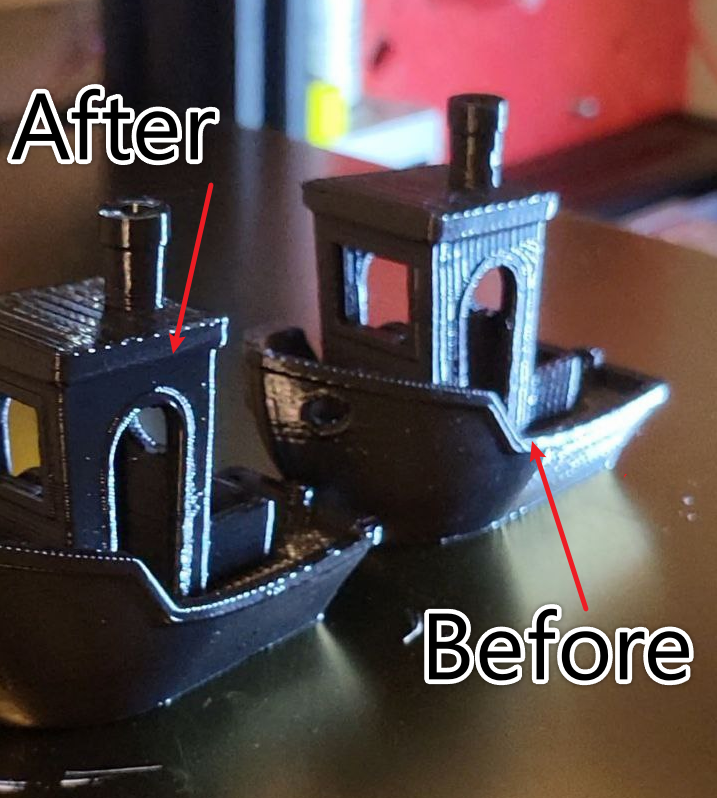
To my surprise, it really worked! Those ripples I was getting were gone; it was like magic.
A ripple-y (before) and not-ripple-y (after) Benchy!
Future Improvements and other notes?
The Frequency Is Embedded in the Print, Right?
You know, it's probably possible to get the frequency from the ripples on the print by measuring their wavelength and using the print speed at that location to figure out a frequency. I wonder how much that lines up with my results?
Should Marlin Be Updated?
The real gangster way of doing this project would be to make a contribution to Marlin's code base (since it's open-source) to support measuring from an i2c-based IMU like the ADXL to get this data. They're super popular and it'd probably be a very welcome addition. However, Klipper really has overtaken Marlin in popularity, so who knows. The Marlin team might even be working on this already.
The whole effort in this project didn't end up mattering because I ended up switching to Klipper and loving its featureset.
Damping?
Marlin's input shaper configuration requires knowledge of the resonant frequency and the desired damping factor (how much do you want to attack that resonant frequency?). In this project, I totally didn't put in the same effort in finding the damping factor, which ideally is a balancing act between attenuating the resonant frequency effects in the print and not losing too much of the desired detail in the print.
Truthfully, I just picked a starting damping factor, put in my resonant frequencies, and the print looked amazing, so I didn't see a need to tune further. There might be some benefit in seeing what the smallest damping factor I could get away with is, but at this point, I've moved on to a different firmware.
Strengthen the Frame!
Another ideal change would be to stiffen the printer's frame to help reduce these vibrations impact. It might even make the frequency so high it's not noticeable (probably not gonna happen). Unfortunately my printer didn't have the proper room for mounting the braces that would stiffen its frame.
Check out my LinkedIn!